
When the Money System Stops Doing Its Job
The U.S. banking system has a structural job: take every dollar the Federal Reserve creates and multiply it through commercial lending. Historically, that multiplier ran around 8–10x — meaning $1 of base money produced roughly $9 in deposits, loans, and credit across the economy.
That multiplication engine broke after 2008. Post-QE, the Fed flooded the system with base money, but banks didn't lend it out at anything close to the historical rate. The multiplier collapsed — and has never recovered to trend.
The gap between what the multiplier should produce (based on the 50-year pre-QE trend) and what it actually produces is the liquidity shadow: the credit that exists on paper but isn't reaching businesses.
This isn't a theoretical concern. The shadow gap is a measurable, historically validated signal that appears before conventional lending surveys, sentiment indexes, and bank earnings reports start showing stress. For business borrowers, understanding where it stands today — and why it matters for each major commercial lending product — can mean the difference between planning ahead and reacting too late.
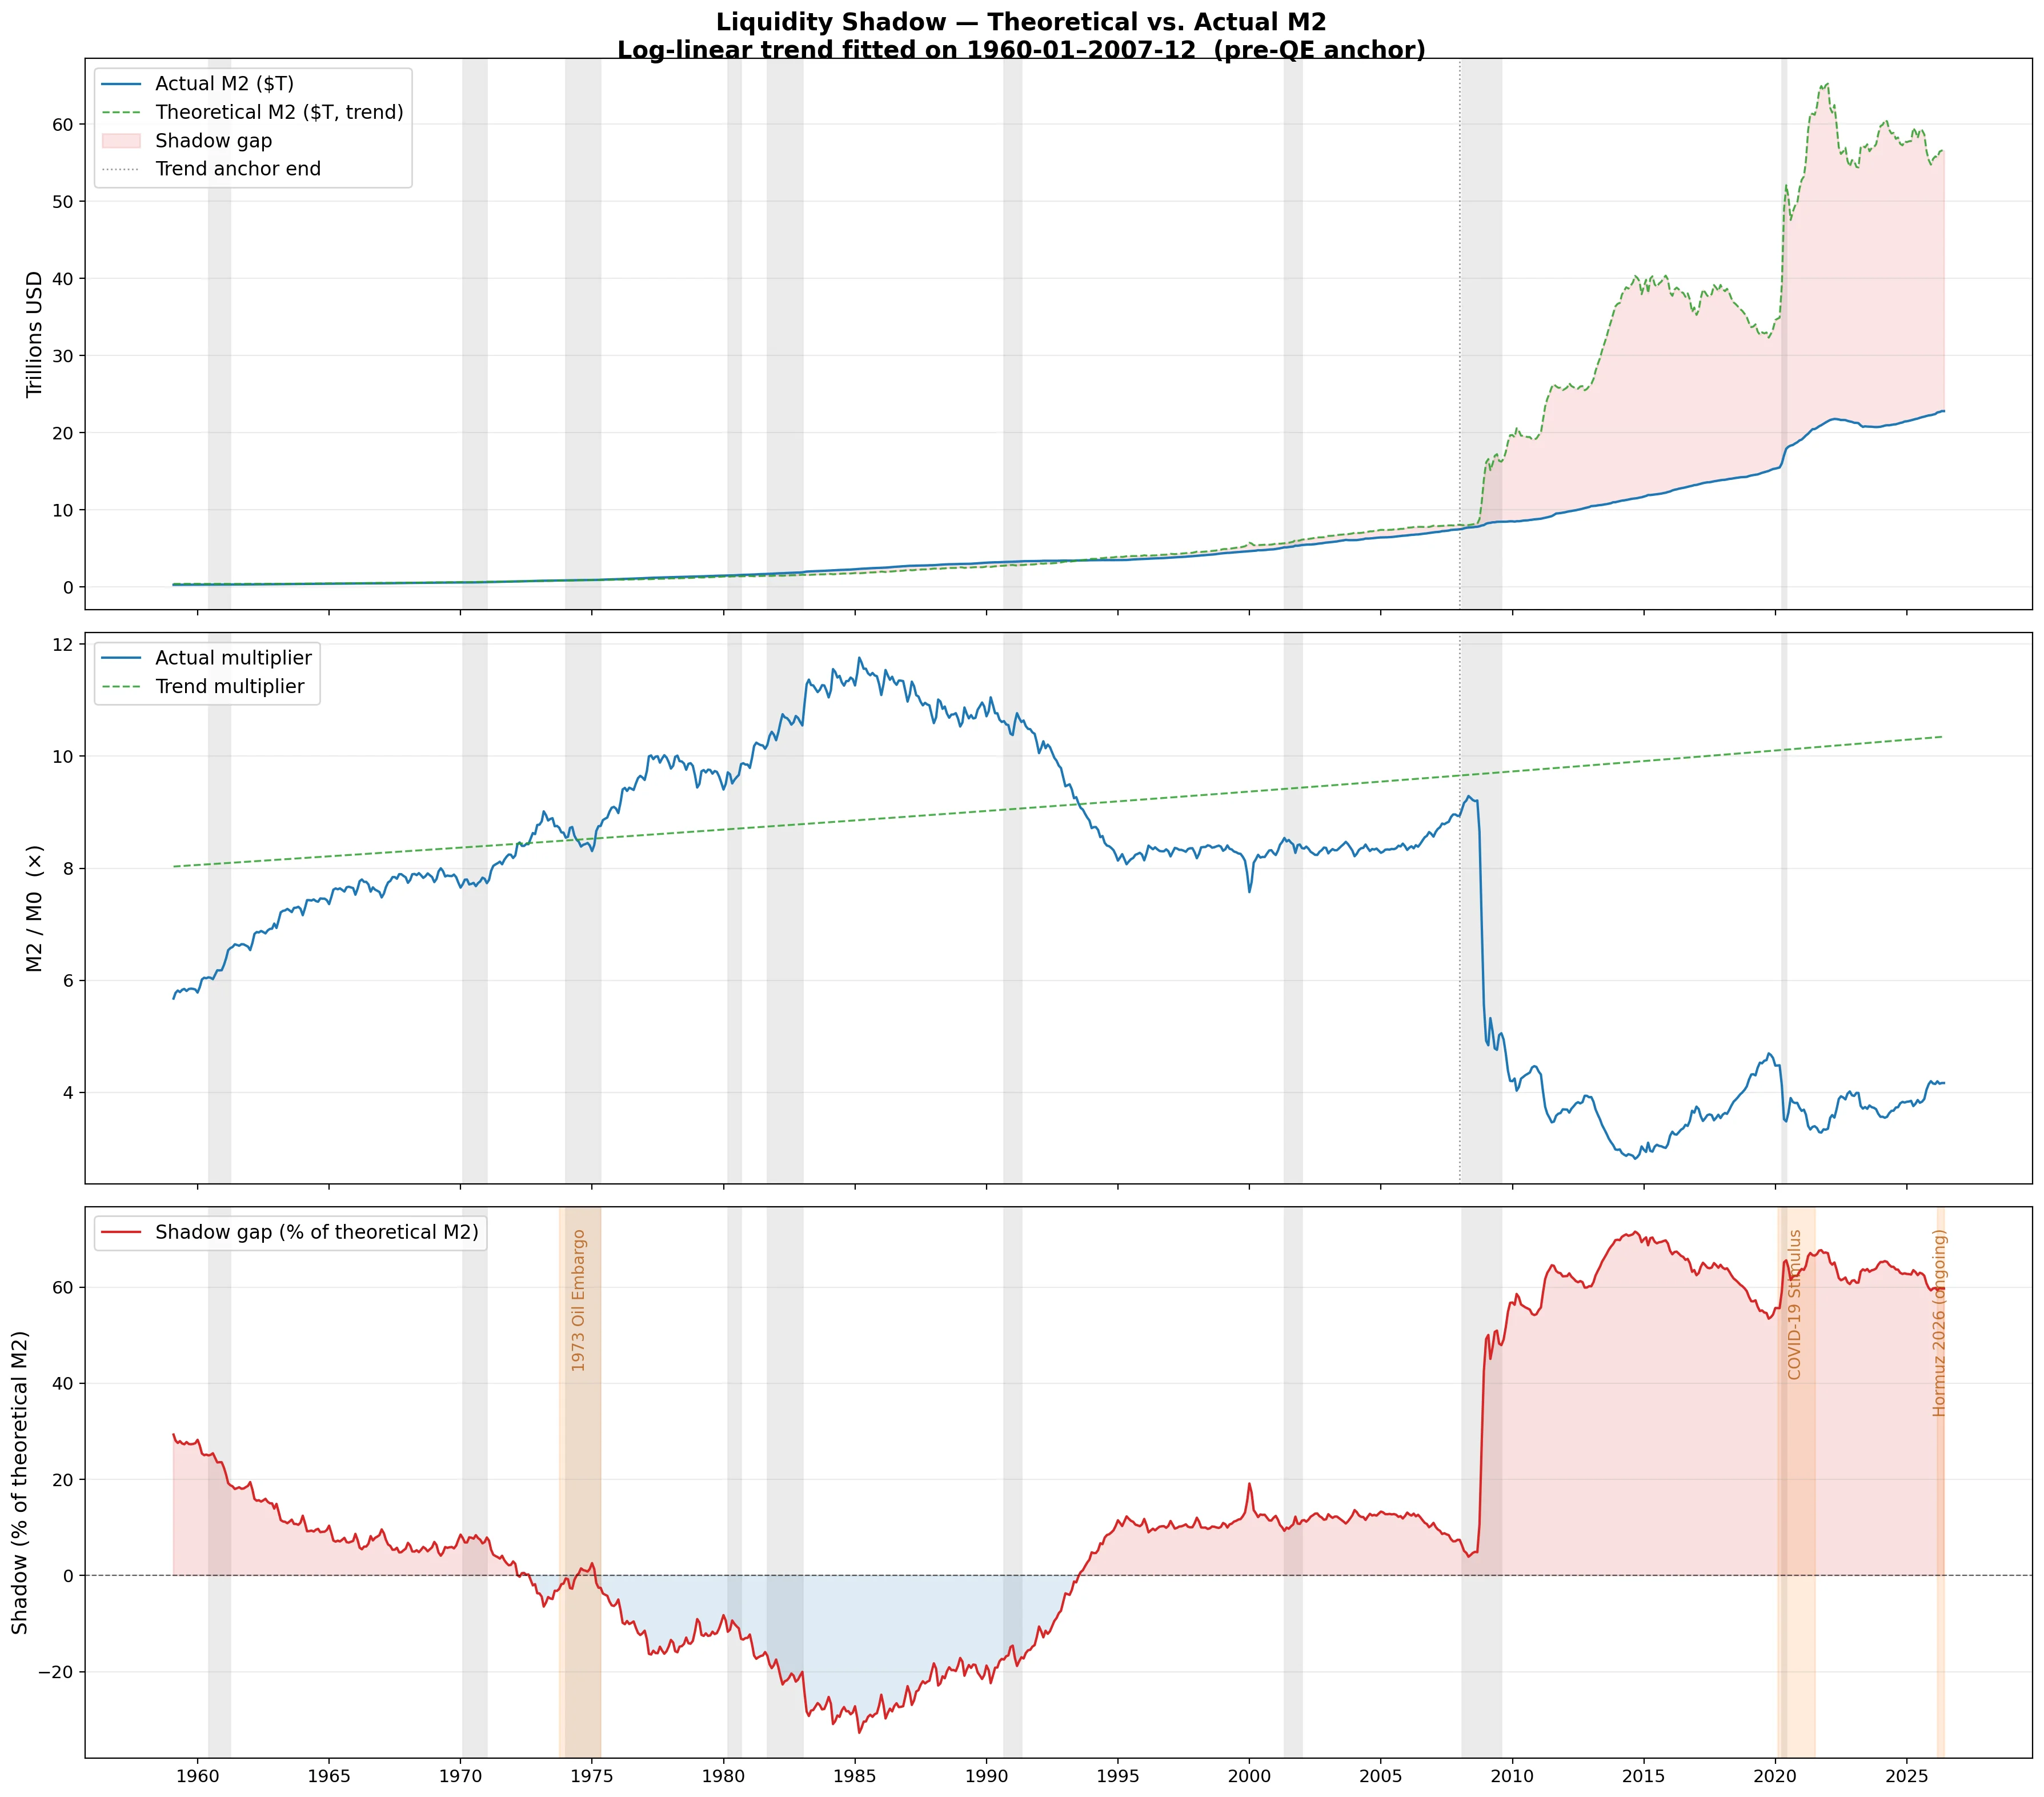
The top panel shows actual M2 (blue) diverging below its theoretical trend (green dashed). The bottom panel isolates the gap as a percentage — positive values mean the economy has less credit than the historical norm would generate.
Reading the Signal: Shadow Level, Velocity, and Acceleration
The raw gap is useful, but the dynamics inside it are what matter for timing. Applying a derivative stack to the smoothed shadow series produces four layers:
- L0 — The shadow gap level itself. Positive = credit below historical norm.
- L1 — Velocity. How fast is the gap widening or narrowing month-over-month?
- L2 — Acceleration. Is the widening speeding up? This is the leading edge of credit stress.
- L3 — Jerk. The turn in acceleration — the earliest possible warning.
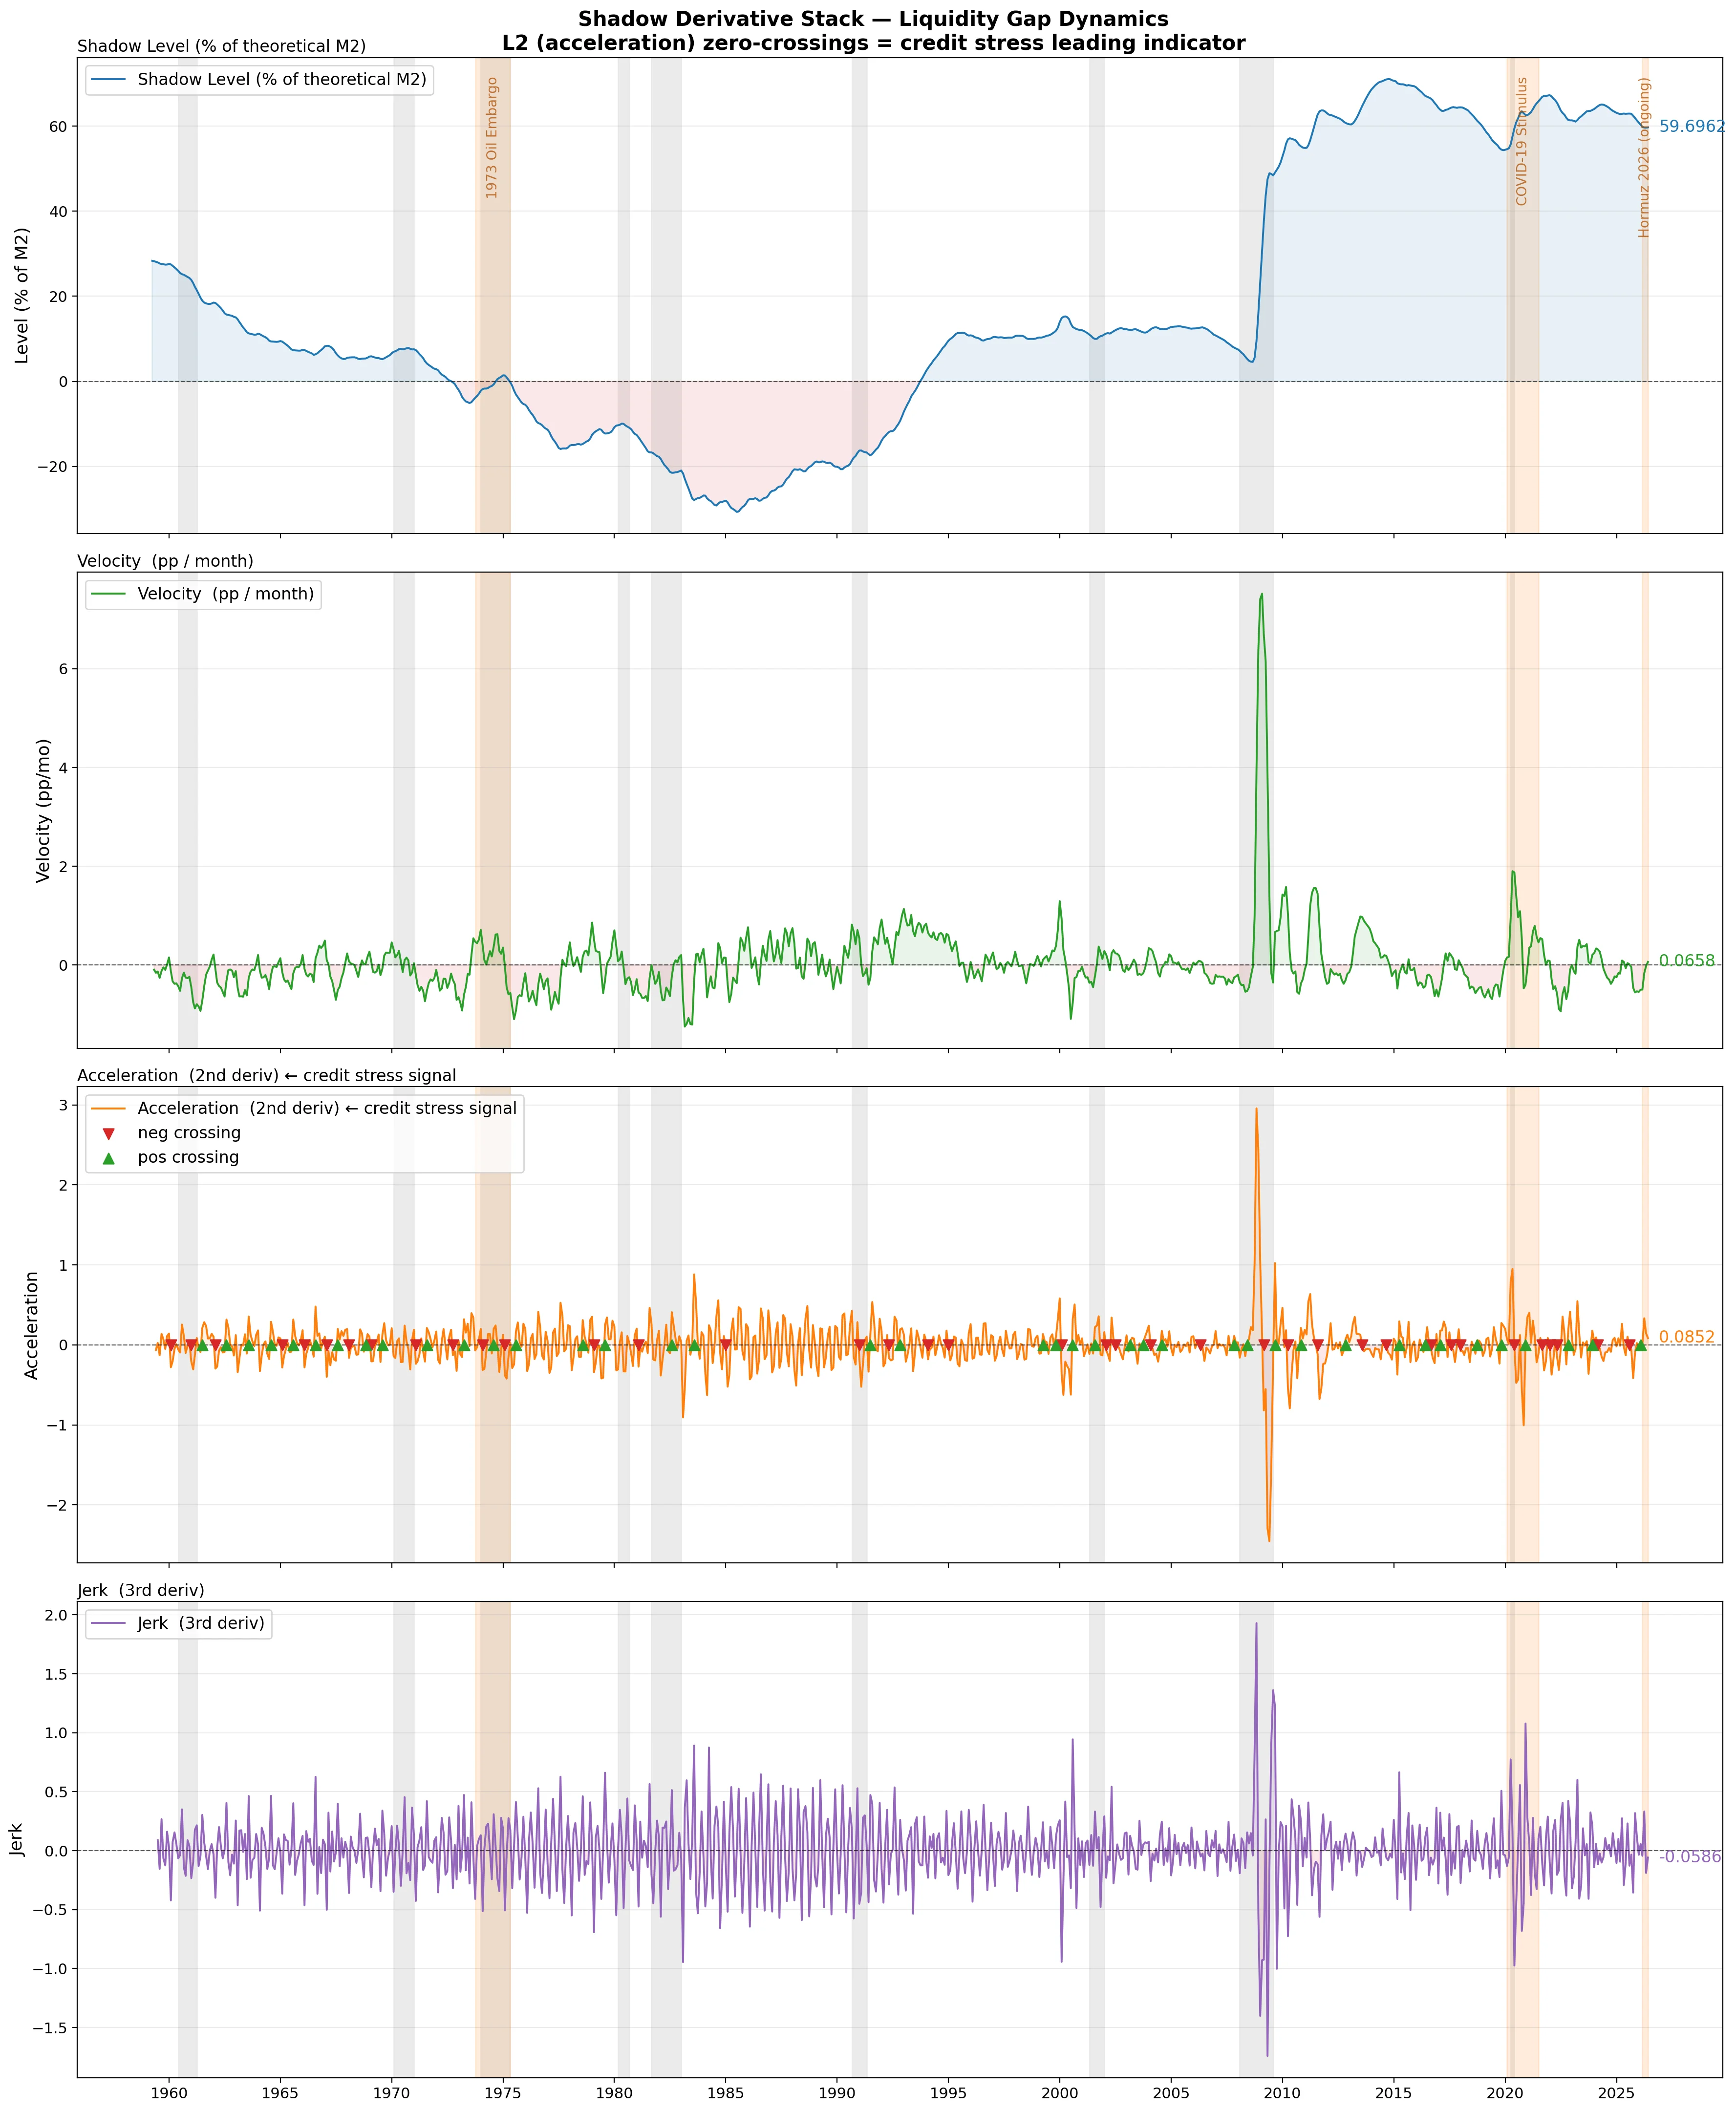
L2 (acceleration, orange panel) is the key signal. When it crosses above zero and holds — a "breach window" — the credit gap is widening faster and faster. These windows have appeared 3–9 months before small-business sentiment surveys turn negative.
The acceleration series (L2) crossing above zero and staying there for three or more consecutive months constitutes what the underlying model calls a breach window. Mapping those windows against NBER recession starts and sentiment-index inflections reveals a consistent lead relationship: the liquidity gap accelerates before borrowers, lenders, or the news cycle recognize a tightening cycle is underway.
The regression against University of Michigan Consumer Sentiment confirms this directionally — shadow acceleration has historically led sentiment deterioration by several months, though the strength of the relationship varies across different credit regimes.
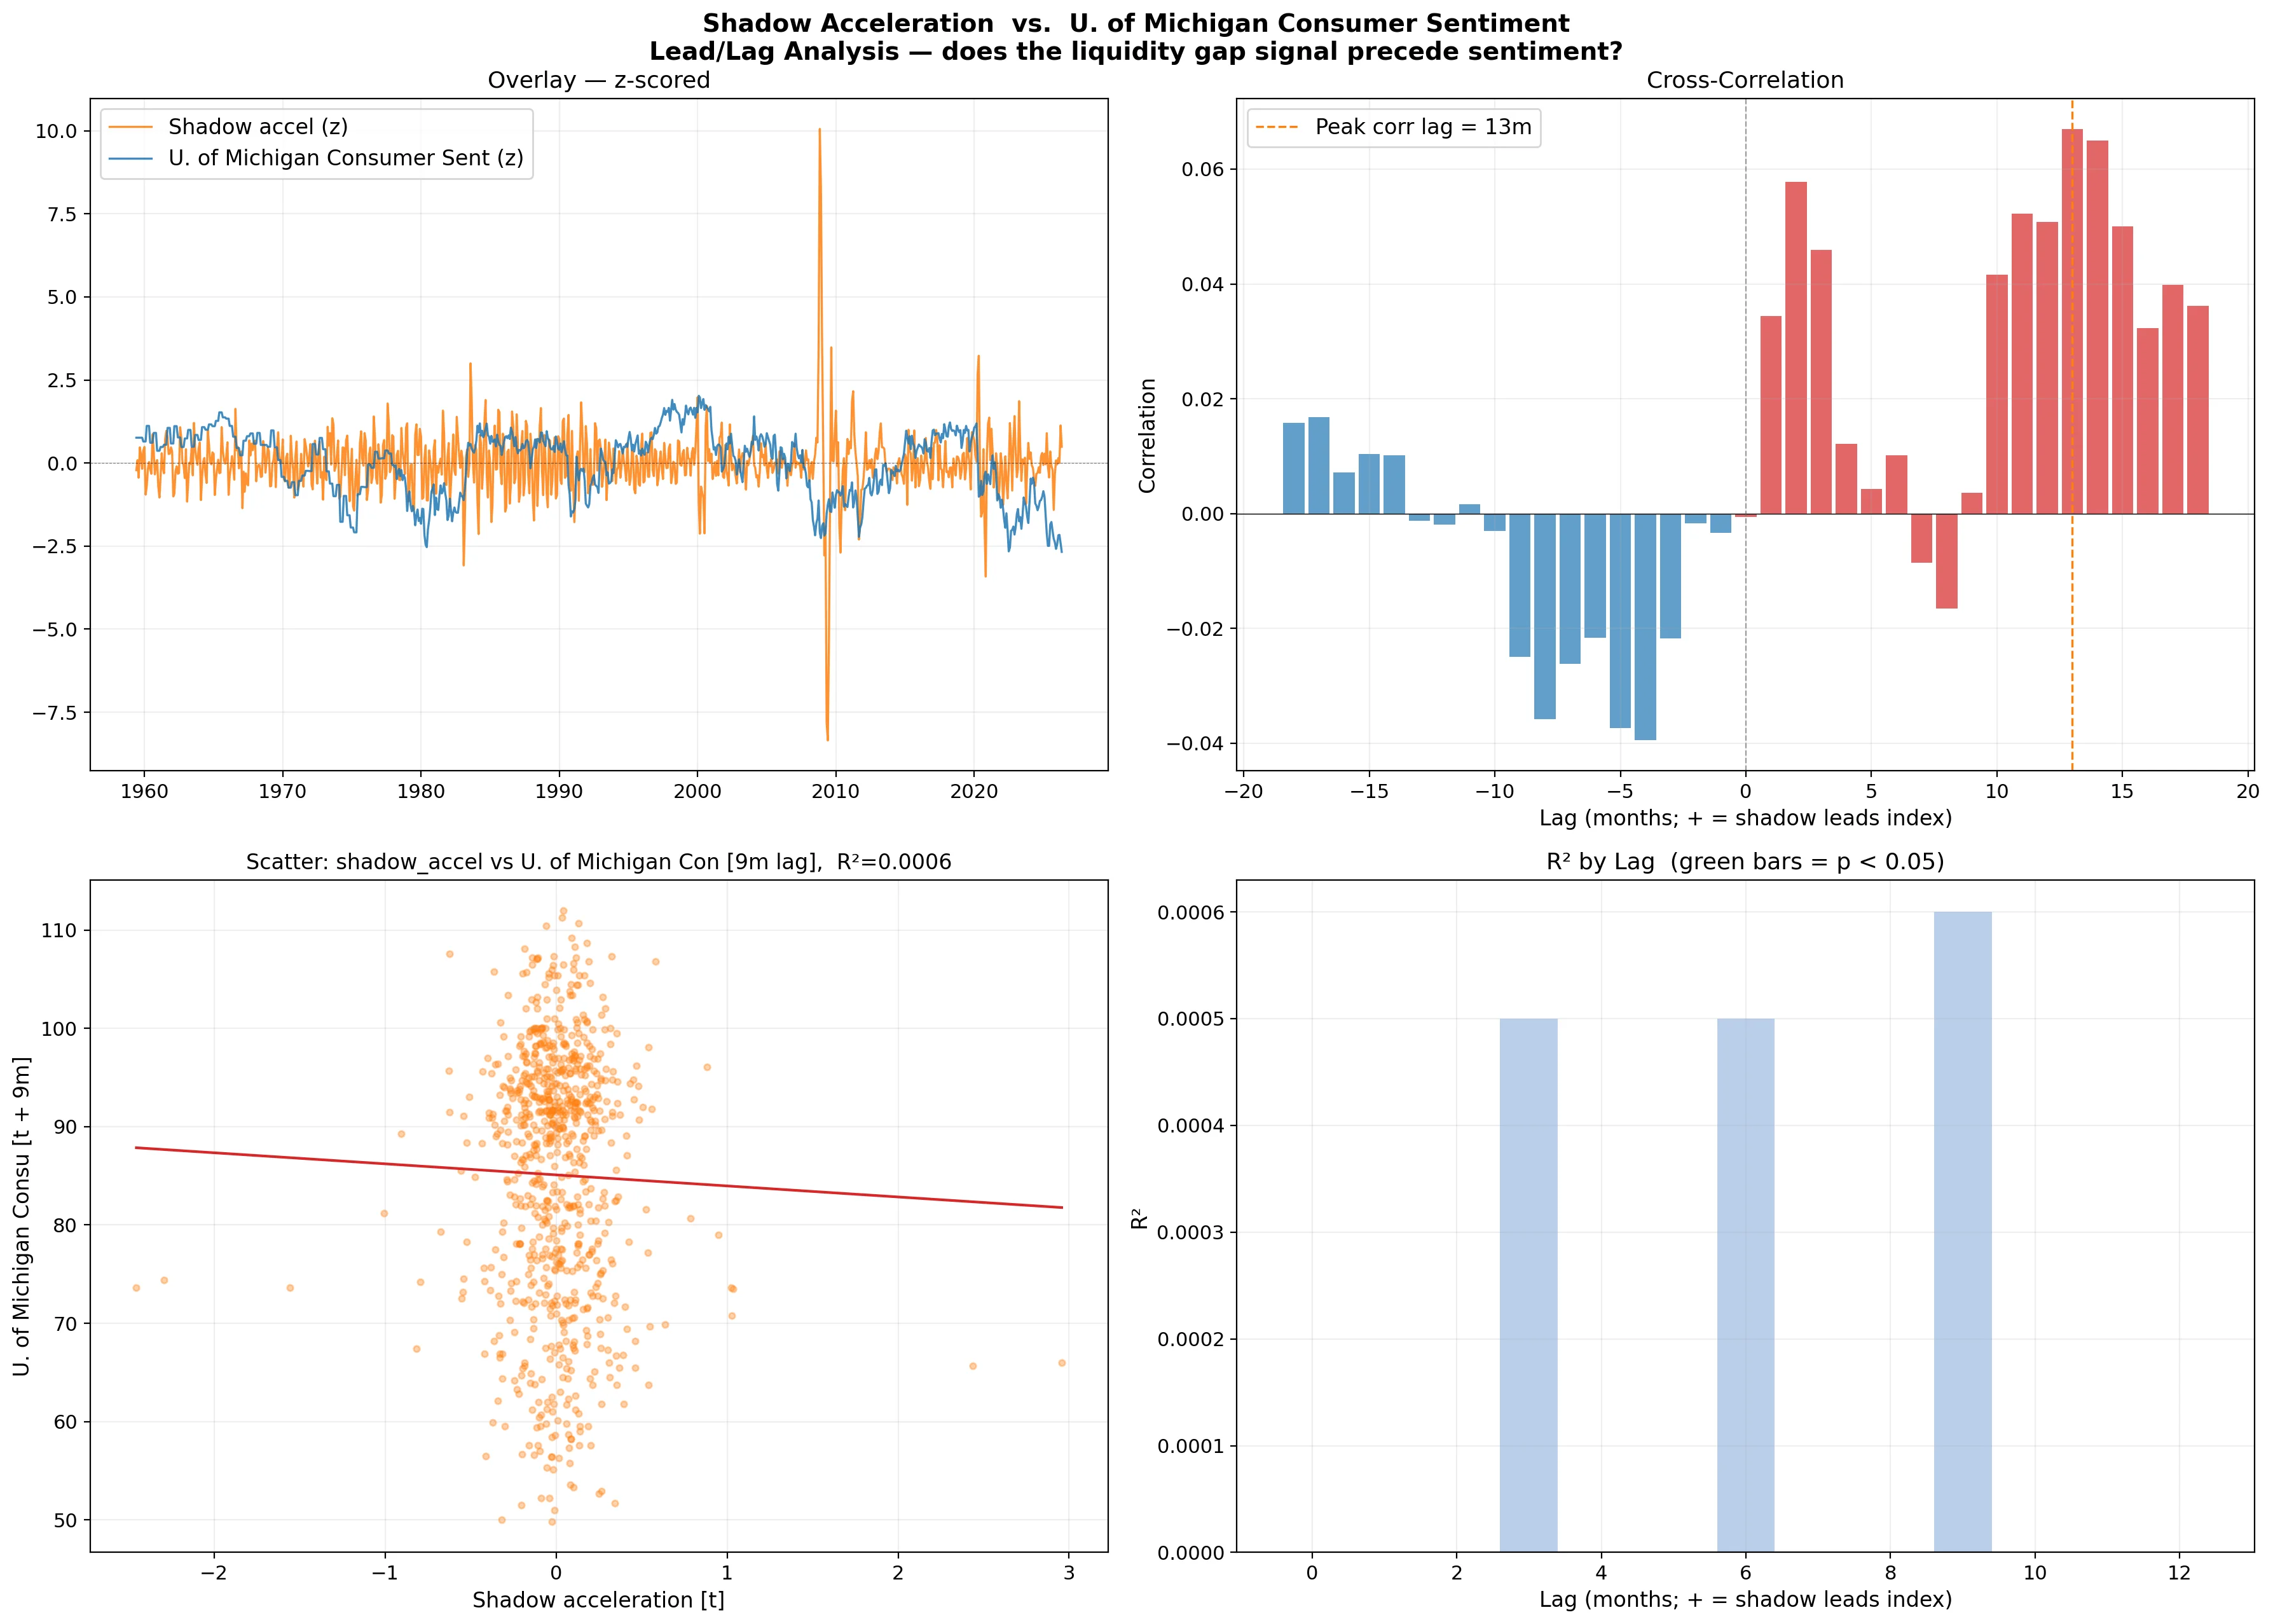
Panel B (cross-correlation) shows peak correlation occurring at positive lags — shadow acceleration leads the index, not the other way around. Green bars in Panel D indicate statistically significant lags.
What This Means for Each Commercial Lending Product
Merchant Cash Advances
MCA demand is almost perfectly counter-cyclical to shadow gap dynamics. When the gap widens at an accelerating rate, traditional bank credit simultaneously contracts: approval rates fall, credit line limits tighten, draw periods shorten. Businesses that can't access revolving credit or term loans turn to the MCA market — faster approval, no collateral, funding in 24–72 hours.
Shadow acceleration is therefore a predictive signal of incoming MCA demand, not a concurrent one. If breach windows historically precede sentiment deterioration by several months, they likely precede the spike in alternative lending applications by a similar window. Businesses don't immediately pivot to MCAs — they first try to renew their bank line, get declined, shop other banks, get declined again, and then reach FundScout. That process takes months.
Business Lines of Credit
Lines of credit are the first product banks pull in a tightening cycle. They're revolving, they're unsecured (or lightly secured), and they represent the most immediately risk-managed exposure on a bank's books.
When shadow acceleration turns positive, banks are already pulling back from new line origination and reducing limits on existing facilities. Business owners who have been relying on a line for working capital find themselves suddenly short — often without a clear explanation from their banker. The shadow signal appears before this manifests in public bank lending surveys.
For borrowers: don't wait for your renewal to discover the line has been pulled. If shadow acceleration is in positive territory, begin exploring alternatives in advance.
Term Loans
Longer-duration debt is insulated from the shadow signal for longer — banks don't immediately stop originating 3–7 year term loans when the multiplier decelerates. But sustained breach windows (6+ months of positive shadow acceleration) correlate with tightening term loan underwriting standards: higher minimum credit scores, lower loan-to-revenue ratios, shorter approved terms.
The current monetary setup compounds this. The RATE_VS_EXPANSION indicator — Fed Funds Rate minus M2 year-over-year growth — crossed negative in December 2025, meaning money growth is running ahead of the policy rate. That signal historically precedes contractionary pressure by a median of 37 months (shock-adjusted). Combined with a widening shadow gap, term loan access from traditional banks is likely to contract over the next two to three years even if no formal recession is declared.
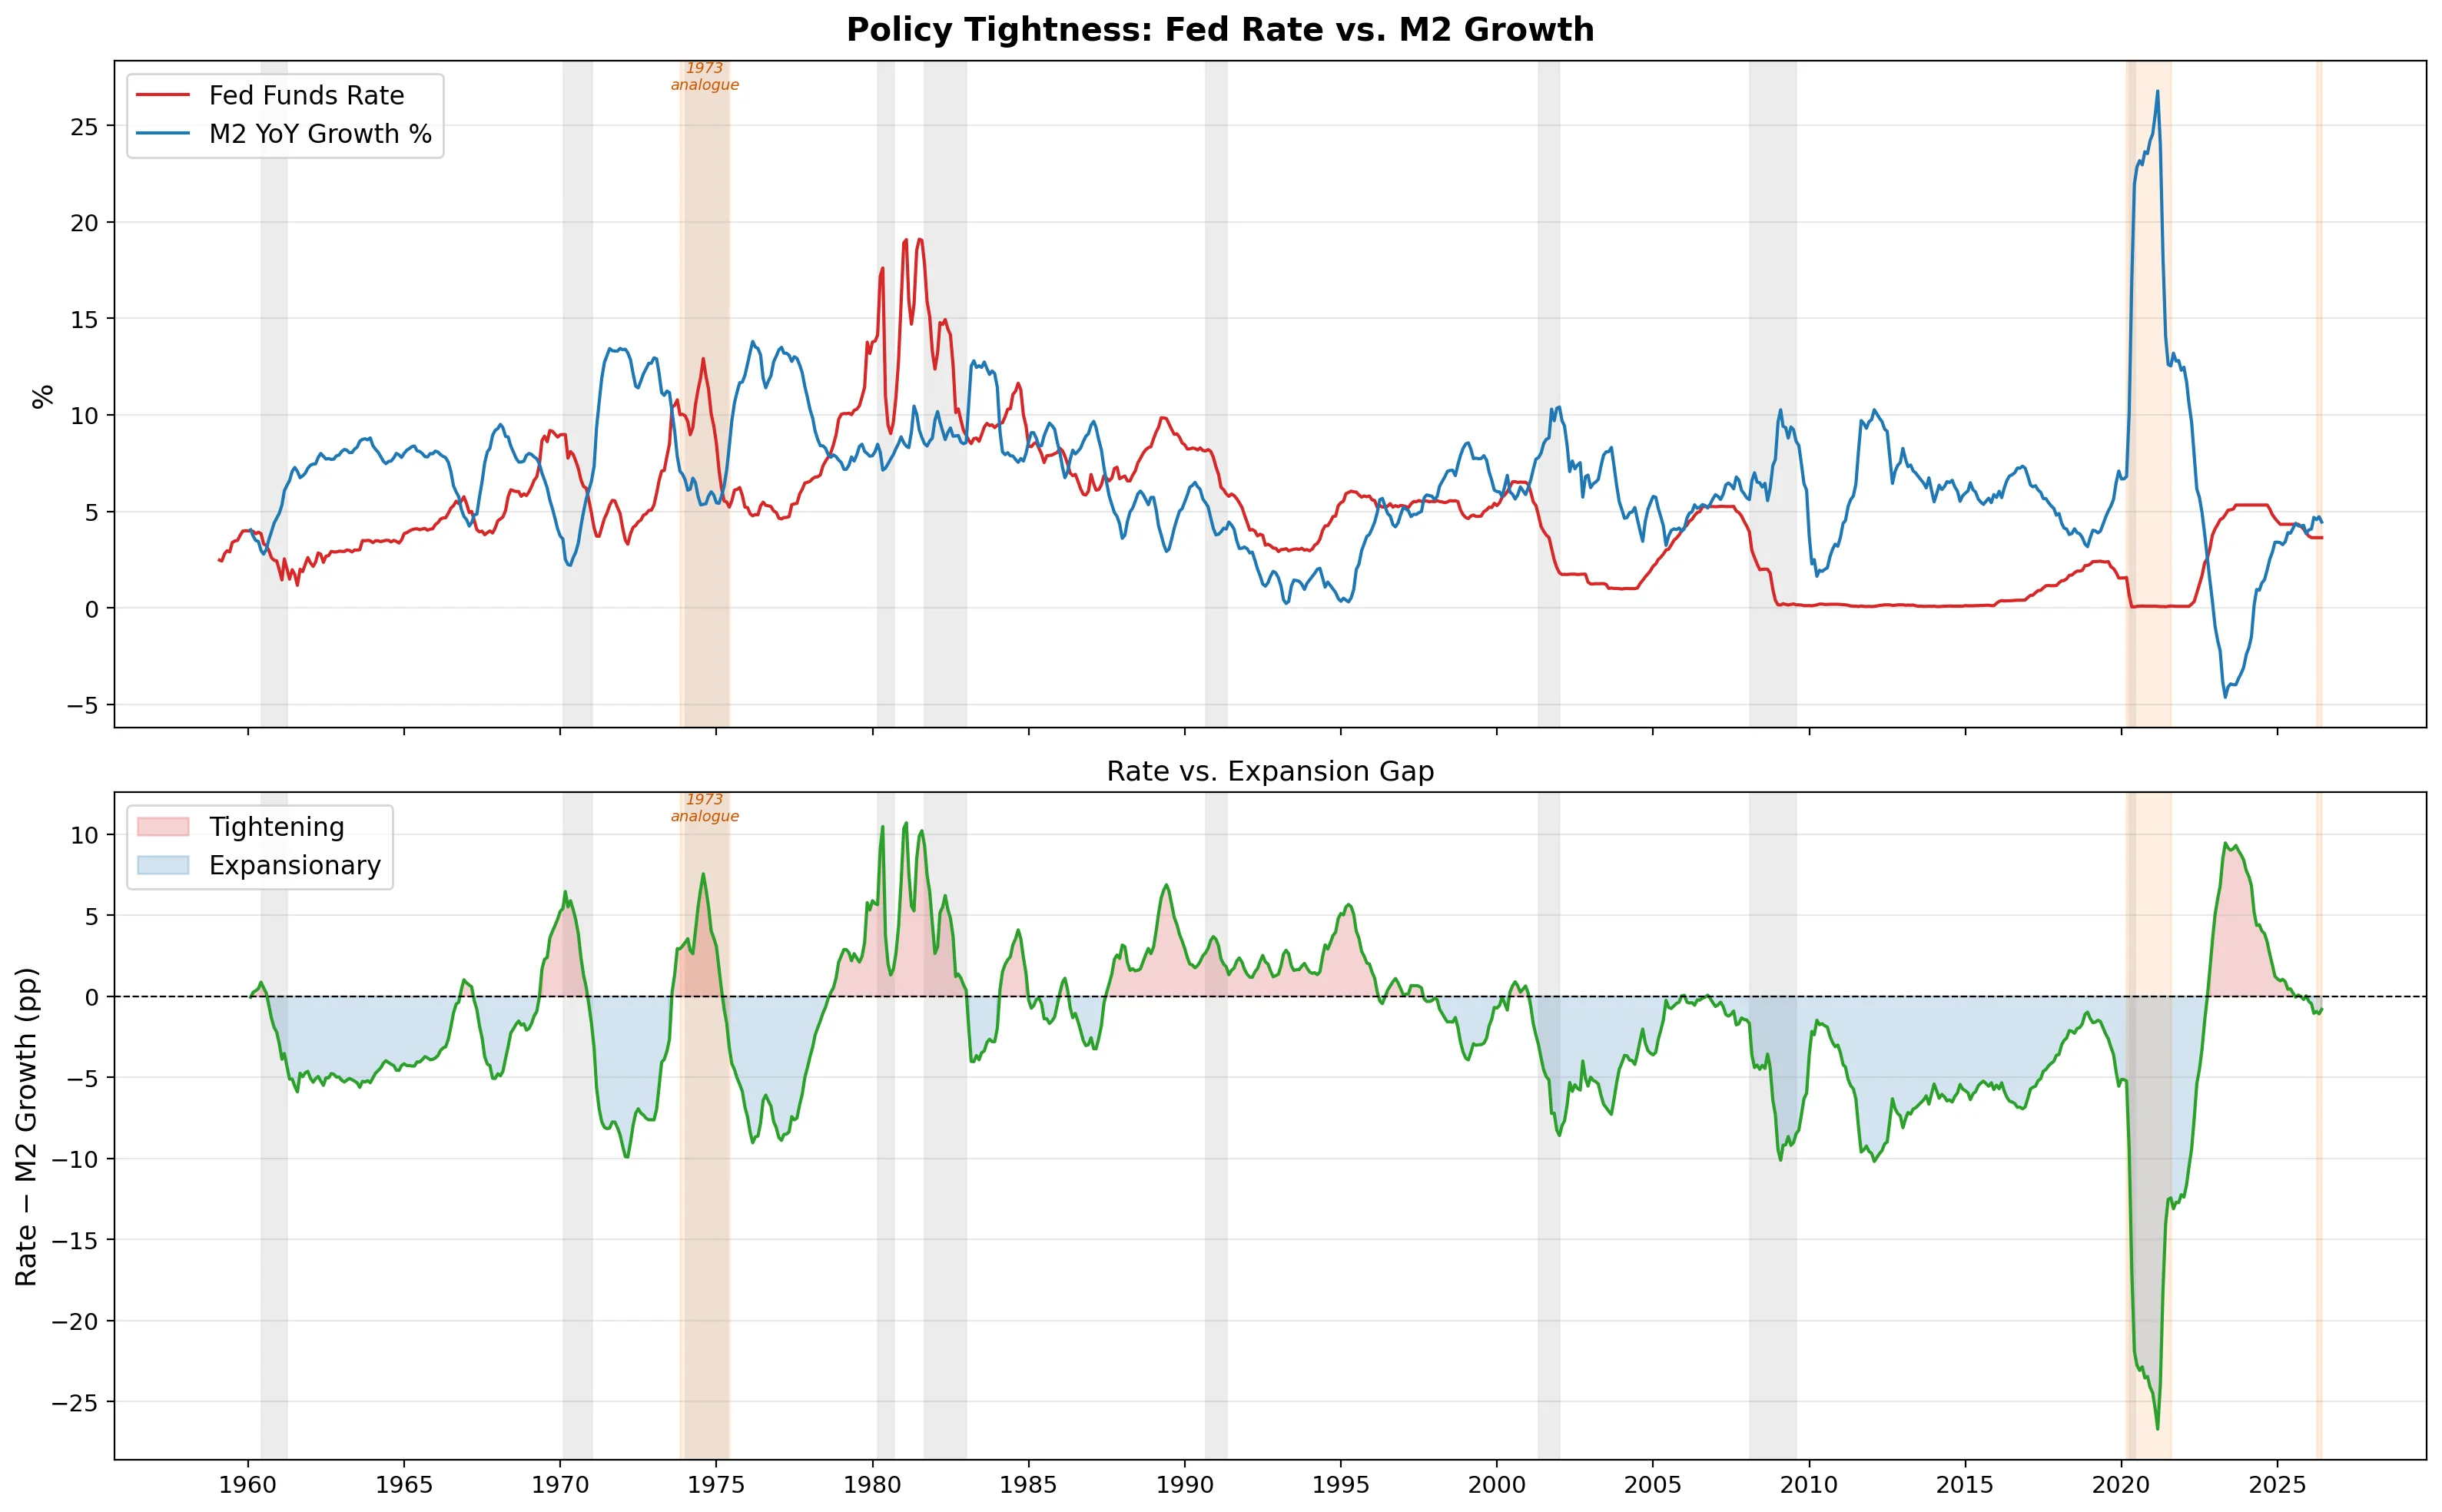
The December 2025 crossing (rate below M2 growth) is a pre-shock signal — it occurred before the Hormuz closure and is therefore not contaminated by the oil shock. The clean median lead time to recession onset across analogous crossings is 37 months.
Equipment Financing
Equipment financing is directly sensitive to the multiplier trend because capital expenditures require confidence in multi-year cash flow projections. When the shadow gap is widening — meaning credit is contracting relative to what a healthy multiplier would create — businesses make the rational choice to defer capex.
This shows up in the approval pipeline: equipment financing lenders see applications drop before they see defaults rise. The shadow gap is not just a signal about credit supply; it's a signal about demand for longer-duration financing. Both sides compress simultaneously.
The Cantillon Spread — M2 growth minus wage growth — amplifies this effect. When M2 is growing slower than wages (or when wages aren't keeping up), consumer-facing businesses face margin compression at the same time financing costs rise. New equipment becomes impossible to justify on a return-on-investment basis.
Commercial Mortgages
Commercial real estate financing is uniquely exposed to the 2026 setup because it sits at the intersection of three forces that are currently all pointing in the same direction:
- Shadow gap positive — less credit creation than structural norms would produce
- December 2025 RATE_VS_EXPANSION crossing — credit environment shifting contractionary over a multi-year horizon
- Hormuz-driven oil inflation — a stagflation trap that prevents the Fed from cutting rates to relieve CRE
The worst scenario for CRE borrowers is elevated rates plus tightening credit standards plus falling asset valuations. That is precisely what the shadow plus rate dynamics describe — and the Hormuz overlay makes it worse by eliminating the Fed's room to maneuver.
New CRE origination will face appraisal headwinds, higher DSCRs required by lenders, and compressing LTV ceilings. Refinancing at maturity is where the most immediate pain lands.
The 2026 Context: Shock on Top of Shadow
One reason the current environment is particularly difficult to navigate is that two distinct pressures are compounding each other.
The shadow gap was already in breach territory — or approaching it — before the Strait of Hormuz closed in March 2026. The December 2025 RATE_VS_EXPANSION crossing was a clean, endogenous signal: a monetary system where money growth was outrunning the policy rate, historically preceding a contractionary turn.
Then the Hormuz shock landed. Oil prices rose from roughly $67/bbl to peaks above $112 (WTI) within weeks — the largest monthly increase in recorded history for Brent. That drove CPI pressures that eliminate the Fed's ability to cut rates, exactly when a credit-tightening cycle would normally call for easing.
The 1973 analogue is directly relevant. The OPEC embargo also landed on a monetary system that was already fragile — post-Nixon gold window, M2 running hot, multiplier near its trend but under pressure. The shock didn't cause the 1973–75 recession in isolation; it crystallized a credit contraction that was already forming. The shock-filtered analysis of the current setup suggests similar dynamics: the endogenous cycle was already turning before March 2026.
What Borrowers Should Do
The shadow signal doesn't mean lending dries up entirely — it means the distribution of available credit shifts. Traditional bank credit contracts; alternative lending scales up. Lenders who don't depend on the bank multiplier (non-bank term lenders, MCA providers, asset-backed lenders) face higher demand precisely when shadow gap dynamics are most pronounced.
For business owners with upcoming capital needs:
- Act before the cycle fully plays out. The lead time embedded in the shadow acceleration signal is your window. Borrowers who secure capital during early breach windows get better terms than those who wait until underwriting standards visibly tighten.
- Diversify your credit relationships. A single bank line of credit is a single point of failure in a tightening cycle. Building relationships with alternative lenders before you need them is materially different from reaching out in distress.
- Know your product. The tightening cycle affects products differently. Equipment financing and CRE face the longest and deepest headwinds. Short-term working capital products from non-bank lenders are more available — but terms vary enormously.
FundScout connects business owners with vetted commercial lenders — including MCA providers, non-bank term lenders, equipment financing specialists, and CRE lenders — without selling your contact information or triggering a spam cycle. If the shadow is signaling what it has historically, the right time to explore your options is before the window closes.
Sources
- Federal Reserve M2 money supply and money multiplier data: Federal Reserve H.6 Statistical Release (Money Stock Measures) — federalreserve.gov; St. Louis Fed FRED series M2SL, MULT
- NBER recession dates: National Bureau of Economic Research Business Cycle Dating Committee — nber.org
- University of Michigan Consumer Sentiment Index: Survey of Consumers — sca.isr.umich.edu; monthly index of consumer economic expectations
- Federal Reserve post-2008 QE balance sheet expansion: Federal Reserve H.4.1 Statistical Release — federalreserve.gov; excess reserves held by banks at the Fed rose from ~$2 billion (pre-2008) to ~$2.7 trillion (2015)
- 1973 OPEC oil embargo: energy price and macroeconomic data from Bureau of Economic Analysis (BEA) and Federal Reserve; recession dated November 1973–March 1975 by NBER
- Federal Funds Rate: Federal Reserve H.15 Statistical Release — federalreserve.gov